- Research
- Open access
- Published:
Estimating the minimum number of opportunities needed for all students to achieve predicted mastery
Smart Learning Environments volume 5, Article number: 15 (2018)
Abstract
We have conducted a study on how many opportunities are necessary, on average, for learners to achieve mastery of a skill, also called a knowledge component (KC), as defined in the Open Learning Initiative (OLI) digital courseware. The study used datasets from 74 different course instances in four topic areas comprising 3813 students and 1.2 million transactions. The analysis supports our claim that the number of opportunities to reach mastery gives us new information on both students and the development of course components. Among the conclusions are a minimum of seven opportunities are necessary for each knowledge component, more if the prior knowledge among students are uneven within a course. The number of KCs in a course increases the number of opportunities needed. The number of opportunities to reach mastery can be used to identify KCs that are outliers that may be in need of better explanations or further instruction.
Introduction
When designing a new course or improving an existing course, there is a need to estimate the number of practice opportunities minimally needed to use prediction models to effectively predict student mastery of the learning objectives and skills. Estimates range from a minimum of two questions for a hidden Markov prediction model (Bier, Lip, Strader, Thille, & Zimmaro, 2014) to four questions for a Bayesian Knowledge Tracing (BKT) prediction model (Baker, R. S. J., personal communication, January 15, 2015). However, more empirical evidence is needed to better understand how many questions, or practice opportunities, are needed to allow all students to achieve predicted mastery. Creating validated questions is time consuming, there are estimates of on average one hour per problem (Piasentin, 2010). Often limited resources require course designers to make tradeoffs in terms of the number of activities and assessment questions they can develop when designing a new course or revising an existing course. For example, The Raccoon Gang (2018) estimates that it takes 100–160 h to produce one hour of ready online learning content. Therefore, it is essential not to waste resources on developing questions that are not needed, while still assuring that the learners will not run out of problem opportunities.
The Open Learning Initiative (OLI), an open educational resource project initiated at Carnegie Mellon University (CMU) and now also housed at Stanford University, creates innovative online courseware and conducts research to improve learning and transform higher education. OLI has begun some initial explorations into using basic Bayesian hierarchical models to predict student mastery (Bier et al., 2014) where learning objectives are defined for each course and are then broken down into skills (also called knowledge components, or KCs). Learning objectives identify what a student will be able to do or know at the end of an instructional unit. Skills define the sub-objective, or knowledge component, that comprise a given learning objective. Students’ mastery of skills are tested through the problems students answer in the digital courseware. All answers are logged. A predictive learning model is then used to determine when each student achieves mastery of each learning objective. In general, predictive learning models are used in learning analytics to predict how well students have mastered a skill, knowledge component, or concept. Historically, OLI has used a Bayesian hierarchical statistical model. The model used students’ responses to previous questions to predict students’ learning states (learned or unlearned) for a given skill but did not account for guessing (correctly answering a question when the student does not know the skill) or slipping (incorrectly answering a question when the student does know the skill). Theoretically, learners in OLI courses would not necessarily have to answer all problems, just a sufficient number to make it probable they have understood a concept. However, OLI courses do not provide students with a path for moving on after they had mastered a skill, either through a forced pathway or by providing data to the student that she had mastered the skill. The OLI prediction model had a built-in assumption that a minimum of two practice opportunities were needed to effectively determine if a student had mastered a skill.
It is still not clear how many opportunities are sufficient in general. We can expect that the number will vary among different KCs, learners and courses, but how much, and how much is the variance? This information could inform course designers. What is the optimal number of problems needed to prevent students from running out of problems practice opportunities before they have mastered a skill while at the same time not spending too many resources on developing problems. This paper will explore what is the minimum number of practice opportunities needed to predict mastery for OLI courses that use a basic Bayesian hierarchical statistical model. Additionally, we will explore whether the minimum number of practice opportunities varies by course content or by level of institution.
Background
Our ability to retain a piece of information improves with repeated exposure and decays with delay since the last exposure (Reddy, Labutov, Banerjee, and Joachims, 2016). Continual repetition usually eventuates in diminished returns (Chen & Squire, 1990; Miller, 1978). To support long-term retention, more practice is necessary but needs to be spread out on an optimal schedule (Anderson et al., 1999; Pavlik & Anderson, 2005). However, for initial learning, more practice becomes over-practice, and once learned, there are also downsides with continued repetition and might even be detrimental under certain conditions. Memory for repeated items decline with increased repetition under incidental-learning conditions (English & Visser, 2013). Response times were significantly longer when a category was repeated aloud for 30 s, as compared to only three seconds (Smith, 1984). This decline in performance with prolonged rehearsal was termed the massed repetition decrement (Kuhl & Anderson, 2011).
One of the downsides of too much repetition is the time it takes from other school subjects and social life. Students who do more hours of homework experience greater behavioral engagement in school but also more academic stress, physical health problems, and lack of balance in their lives (Galloway et al., 2013). Many teachers believe that giving students more practice problems is beneficial and “would like to have the students work on more practice problems”, even when “[students] were not making any mistakes and were progressing through the tutor quickly” (Cital, 2006 in Cen, Koedinger & Junker, 2007).
However, it is possible to reduce study time without loss of learning. In a study of high school students participating in the Optimized Cognitive Tutor geometry curriculum, it was found that 58% out of 4102 practices and 31% of 636 exercise questions were done after the students had reached mastery (Cen et al., 2007). Results were compared to students participating in the traditional Cognitive Tutor geometry curriculum. Analyses indicated that students in the optimized condition saved a significant amount of time in the optimized curriculum units, compared with the time spent by the control group.
OLI evaluations have investigated the effectiveness of both stand-alone (completely online) and hybrid (supplemented with teacher interaction) compared to traditional instruction. Most remarkable is a study on Statistics students who learned a full semester’s worth of material in half the time while performing as well or better on tests and final exam compared to students learning from traditional instruction over a full semester (Lovett et al., 2008).
Online instruction thus can surpass traditional instruction in efficiency, but to do this, online systems also requires a lot of practice problems and these can be resource demanding to construct and verify. There are generic ways to define certain problems so that the possibility of running out of problems will, in practice, never occur (Bälter, Enström, and Klingenberg, 2013). However, these generic ways require possibilities to define questions and answers from a set of variables. The question and its answers need to be programmed. These features are rare in most learning management systems, which make the number of problems necessary to construct an important factor when developing new courses. Additionally, the OLI courses are designed to support scaffolded learning focused on conceptual understanding not procedural repetition. Therefore, problems with randomly generated values for a given set of variables that require calculations to answer do not fit the learning objectives for most OLI courses.
In order to use the data stream from online learning environments to estimate learning we need a theoretical model of learning. We, as many others, begin with learning objectives that precisely specify the skills and competences needed to be mastered by the learner. Such learning objectives are crucial for both the design process of effective teaching, on the one hand, and the assessment of the learning outcome (i.e., skills and competences), on the other hand (Marte et al., 2008). A further extension is to assume dependencies between the skills, (e.g. Korossy, 1999), inducing a competence structure on the set of skills, but this is not in use (yet) in OLI. A comprehensive review and evaluation of existing frameworks for teaching, learning and thinking skills is provided in a report by Moseley et al. (2004). There are also ways to use statistical modeling to create a skills map that reportedly outperforms human experts (Matsuda et al., 2015).
The Bayesian hierarchical learning model used to predict mastery of skills and learning objectives in OLI courses assumes a two-state learning model. Learners are either in the learned or unlearned state for a given skill. Students can transition from unlearned to learned state at each opportunity to practice that skill (typically by answering a question on the skill). After each opportunity, the model estimates the probability that the student has learned the skill (p(L)). At each opportunity, the estimate for p(L) is updated based on whether the student answered the question correctly or incorrectly (Corbett & Anderson, 1994).
OLI courses contain two types of opportunities: formative assessment questions embedded throughout a module where students can answer the questions multiple times with immediate feedback given after each attempt and summative assessment questions at the end of a section module that act as “quizzes” or “checkpoints” before the student progresses to the next section or module. All opportunities are equally weighted in the OLI predictive learner model. The OLI predictive learner model uses only the student’s first attempt at answering the problem as this is considered the most honest attempt. The rationale for this is that the OLI system provides immediate feedback to all formative assessment questions so after answering a question for the first time students tend to click through all the answer choices and review the feedback for each. Lastly, the model used in OLI assumes that once a student learns the skill she cannot transition back to the unlearned state (i.e., there is no parameter for forgetting in the model).
OLI has contributed much of its data to the Pittsburgh Science of Learning Center’s DataShop (http://pslcdatashop.org/), a central repository to store research data that also includes a set of analysis and reporting tools. In one of its standard reports, DataShop provides “predicted learning curves” which are the average predicted error of a knowledge component over each of the learning opportunities. Learning curves as a method to explain user-computer interaction evolved out of the work of Newell & Rosenbloom (1981). They demonstrated how learning is a power function based on the number of trials at practicing a skill. The greatest learning on a skill occurs early on and lessens with additional practice (Newell & Rosenbloom, 1981). However, Anderson et al. (1989) found that this power relationship may not always hold true with complex skills. In general, learning curves can be used to demonstrate students’ learning rates over repeated trials practicing a skill (Koedinger & Mathan, 2004).
Other models
A full background on learning models is beyond the scope of this paper. However, below we present a brief description of other learning models to demonstrate alternate options for predicting student mastery. Additionally, we recognize the prediction model currently used in OLI courses does not reflect recent advances in learner modeling and as a result may introduce error into the modeling of knowledge components.
Other predictive learning models that have been developed are extensions of or new approaches to predicting student mastery. These models are used to predict the probability that a student can answer the next question on a given skill correctly and use a binary outcome for correctness (correct or incorrect). An assumption underlying these models is that each question involves a single skill (Pardos, Gowda, Baker, & Heffernan, 2012).
Bayesian Knowledge Tracing, or BKT, uses a similar modeling approach as the Bayesian hierarchical learning model used by OLI in that is includes parameters for prior learning and the transitioning from an unlearned to a learned state, but also includes parameters for guessing (the student is in an unlearned state but correctly answered by guessing) and slipping (the student is in a learned state but incorrectly answered due to making a mistake) (Corbett & Anderson, 1994). This standard BKT model uses skill-specific parameters. Yudelson, Koedinger, and Gordon (2013) discovered that including student-specific parameters, specifically speed of learning, improved mastery prediction compared to the standard BKT model. Lee & Brunskill (2012) used student-skill pairs to build an individualized model and found that a considerable fraction of students, as judged by individualized model, would have received a significantly different amount of practice problems from the Intelligent Tutoring System. Standard BKT models typically require a minimum of four opportunities per skill (R. S. J. Baker, personal communication, January 15, 2015).
Additive Factor Models (AFM) is a logistic regression model that includes student ability parameters, skill parameters, and learning rates. AFM assumes all students accumulate knowledge in the same way and disregards the correctness of individual responses (Chi, Koedinger, Gordon, Jordon, & VanLahn, 2011).
Performance Factors Analysis (PFA) is also a logistic regression model that is an elaboration of the Rasch model based on Item Response Theory. PFA, unlike AFM, uses a student’s number of prior failures (incorrect answers) and prior successes (correct answers) on a skill to predict correctness. Unlike BKT, no iterative estimates of latent student knowledge are made but rather the number of successes and failures are tracked and these are used to predict future correctness (Pardos et al., 2012).
While knowledge tracing (KT), Additive Factor Models (AFM), and Performance Factor Models (PFM) are the three most common student modeling methods (Chi et al., 2011), there are other models emerging. A different approach to learning modeling is the use of artificial neural networks. They are usually used to model complex relationships between inputs and outputs and to find patterns in data. Neural networks can capture nonlinear relationships between concepts, do not require a function to which the data need to be fitted, and are updated as more historical data becomes available (Oladokun et al., 2008). Deep Knowledge Tracing (DKT) is a flexible recurrent neural network model that not only predicts students future performance based on their past activity but also supports selecting the best sequence of learning items to present to a student (Piech et al., 2015).
In addition to BKT, AFM, PFA, and artificial neural network models, other predictive models include linear, Markov, and rule induction models (Zukerman & Albrecht, 2001) as well as regression, instance-based, regularization, decision-tree, clustering, deep learning, dimensionality reduction, and ensemble models (Brownlee, 2013). There are also adaptive learning models (Boulehouache et al., 2015) such as Felder-Silverman (Kolekar, Pai, & Pai, 2016).
Learning curves and their classification
When asking learners a question on a skill they are learning, instructors aim for many, but not all, of the learners to be able to answer the question correctly. If no one is able to answer the question correctly, it is above their present abilities, and if everyone can answer it correctly it is not worth their effort. Regardless what the ideal percentage of correct answers for a first question should be, the learning system should give feedback to individual learners about why their answer was wrong and how they should think in order to get it right. When that is done correctly, we expect for the second question of the same skill that the percentage of wrong answers is reduced, see Fig. 1.

Theoretical learning curve when instructions, questions and feedback are working properly
There are many things that can go wrong: the instructions could be difficult to interpret, the questions, or their answer alternatives, could be unclear or not realistic, the feedback could be irrelevant, the sequence of problems could be wrong, the problems could be too difficult or easy, the problems could be measuring a different skill than intended, etc. However, when everything works well, we should be able to see learning curves similar to Fig. 1, and if we do not, we know that the learning material needs more work.
When interpreting learning curves, a flat high curve indicates students did not learn the skill, a flat low curve suggests that students already knew the skill and did not need further instruction, and a curve that trends upwards indicates the skill is increasing in difficulty rather than decreasing. Viewing learning curves can help make quick inferences about how well students are learning various skills and which skills may need additional instructional support and/or refinement in how they are assessed (Baker, 2010).
After several practice opportunities, we would like the risk of a wrong answer to approach zero to show that the learners have mastered a skill. However, we need to take into account the possibilities of guesses and slips.. This mastery threshold is by default 20% in DataShop, where we store and analyze our data sets (Koedinger et al., 2010). DataShop also includes an algorithm categorizes learning curves. If a curve is low (below the 20% threshold) and flat, it indicates that students had mastered that skill already when the course began or that they overpracticed. If the last point of the curve is above the high error threshold (40% is default), then the curve is still high. If the slope of the predicted learning curve (as determined by the Additive Factor Model (AFM) algorithm) is close to zero (absolute value below 0.001 as default), then the curve shows no learning. All KCs that do not fall into any of the above “bad” or “at risk” categories are considered “good” learning curves in the sense that they appear to indicate substantial student learning (PSLC DataShop, 2015). This classification is only done on KCs that have a sufficient number of students (10 is default) and opportunities to answer (3 is default).
Methods
This study addresses the following research questions:
-
What is the minimum number of practice opportunities needed to predict student mastery of skills?
-
Does the minimum number of practice opportunities vary by course content (Statistics, Biology, Engineering Statics, and Psychology)?
-
Does the minimum number of practice opportunities needed to predict mastery vary by level of institution (Associate’s, Baccalaureate, Master’s and Doctoral colleges/universities)?
We used OLI datasets stored at the Pittsburgh Science of Learning Center (PSLC) DataShop from four different OLI topic areas: CC-Statistics Spring 2014, OLI Biology: ALMAP spring 2014, OLI Engineering Statics - Fall 2011 - CMU and OLI Psychology MOOC GT - Spring 2013 (100 students) (Koedinger et al., 2010).
The statistics dataset comprises student data from instructors who taught with the OLI Probability & Statistics course in the spring 2014 term (January–May, 2014). This course introduces students to the basic concepts and logic of statistical reasoning and gives the students introductory-level practical ability to choose, generate, and properly interpret appropriate descriptive and inferential methods. In addition, the course intends to help students gain an appreciation for the diverse applications of statistics and its relevance to their lives and fields of study. The course does not assume any prior knowledge in statistics and its only prerequisite is basic algebra.
The biology dataset comprises student data from instructors who taught with the OLI Introduction to Biology course in the spring 2014 term (January–May, 2014). This introductory course defines biology and its relationship to other sciences. The course examines the overarching theories of life from biological research and also explore the fundamental concepts and principles of the study of living organisms and their interaction with the environment. The course examines how life is organized into hierarchical levels; how living organisms use and produce energy; how life grows, develops, and reproduces; how life responds to the environment to maintain internal stability; and how life evolves and adapts to the environment.
The engineering statics dataset comprises student data from instructors who taught with the OLI Engineering Statics course in the fall 2011 term (August–December 2011). Statics is the study of methods for quantifying the forces between bodies. Forces are responsible for maintaining balance and causing motion of bodies, or changes in their shape. You encounter a great number and variety of examples of forces every day, such as when you press a button, turn a doorknob, or run your hands through your hair. Motion and changes in shape are critical to the functionality of man-made objects as well as objects the nature. This course uses algebra and trigonometry and is suitable for use with either calculus- or non-calculus-based academic statics courses. Completion of a beginning physics course is helpful for success in statics, but not required. Many key physics concepts are included in this course.
The psychology data set comprises student data from instructors who taught with the OLI Introduction to Psychology course in the spring 2013 term (January–May 2013). This course offers students an engaging introduction to the essential topics in psychology. Throughout this study of human behavior and the mind, you will gain insight into the history of the field of psychology, as well as explore current theories and issues in areas such as cognition, motivation, and wellness. The importance of scientific methods and principles of research design is emphasized throughout this course and presented in a way that will enrich your study of individuals as thinking, feeling, and social beings.
From each dataset, the transactions with KCs classified as “Good” were selected and exported. Each transaction contained information on anonymous student id, KC name, attempt number, and predicted error rate and additional information that were not used in this analysis.
A Java program was written to extract information from each student and KC combination how many attempts were necessary to achieve mastery for that KC (i.e. identify the first attempt where the predicted error rate became lower than the mastery threshold of 20% (the amount of error allowed in the prediction of mastery), the default value set in DataShop) and whether the student reached mastery or not for each KC. According to DataShop documentation, the 20% threshold comes from Bloom (1968), where he found that 20% of students were already attaining mastery levels in their learning without improved learning techniques (Koedinger et al., 2010). This information was subsequently used to make comparisons of descriptive statistics and conduct two-sample t-tests and ANOVA (ANalysis Of VARiance) tests where appropriate.
Results
Statistics course
For the statistics course, see Table 1 for a summary, the mean number of attempts to reach mastery over all 45 good KCs was 4.4 with a standard deviation of 4.0 (n = 13,411). We have one outlier at 16.6. This is the KC “pvalueinterp”. The second highest at 9.9 is “hyptest-logic”. The KC “pvalueinterp” is the skill “Interpreting p-value” and “hyptest-logic” is “Logic of hypothesis testing.” Questions related to these two KCs appear extensively in the Inference unit of the Probability & Statistics course. In particular, the “pvalueinterp” skill involves interpreting p-value results from various types of statistical tests from a s-test for the population mean to chi-square tests. It could be that interpreting the p-value is not a generalizable skill across different contexts but rather is multiple skills and/or requires more practice than less complex skills. The same may be true for “hyptest-logic” in that the process of hypothesis testing for different statistical tests may be multiple skills that requires additional practice than less complex skills.
If we reduce the mastery limit to 10% and use the same 45 KCs we get a slight increase, with a mean of 5.0 and a standard deviation of 3.7 (n = 5196). We still have one outlier at 15.1 which is still the KC “pvalueinterp”. The second highest at 10.7 is “probtools” (Probability tools) and 10.4 is “samplespace” (Identifying sample space). The previously second highest “hyptest-logic” is now at 5.8.
We can divide the students into students attending two-year colleges and four-year colleges and their means and standard deviations are shown in Table 2. As expected the mean is lower for the four year colleges.
A Welch Two Sample t-test on these two groups gives t = 11.735, df = 3096.8, p-value < 2.2e-16, 95% confidence interval: 1.0–1.4. If we just compare the mean values for each KC, we get in a Two Sample t-test, t = 2.2705, df = 87, p-value < 0.013, with mean values 6.1 for two year colleges and 4.1 for four year colleges.
A Welch Two Sample t-test gives a similar p-value: (t = 2.2523, df = 56.966), p-value < 0.014.
We have, besides “pvalueinterp” at 36 and “hyptest-logic” at 17, three high values for the two-year colleges. These are the KCs “ztestcond” (Conditions of z-test and t-test), “translate-probdist” (Application of probability distribution) and “probtools” (Probability tools). The KC related to identifying conditions for when to use a z-test and t-test is the first major topic in the Inference section of the OLI Probability & Statistics course. Students who have had no prior experience with statistics, which is often the case at two-year colleges, tend to struggle when in the first part of the Inference unit. Also, two-year college students tend to have less background knowledge in that area so it is not surprising that two of the outliers are related to probability topics.
As the means are important for the further discussion, we will not include the two outliers in the analysis below.
Another way to divide the colleges is to use “Carnegie Classification of Institutions of Higher Education” (2005). This classifies American colleges and universities into one of 31 groups. For our purpose we need fewer groups and preferably a sorting order. Therefore, we mapped the 23 participating colleges into one of four primary categories: Associate’s, Baccalaureate, Master’s and Doctoral colleges/universities. One of the participating colleges was Canadian and was classified as a Doctoral university based on information on the number of graduated Ph.D. students on their web page.
In Tables 3 and 4 we can see that the mean drops as expected between Associate’s, Baccalaureate/Master’s and Doctoral colleges. The similarities between the Baccalaureate and the Master’s college students may be surprising, but it may be that the student populations at master’s-degree granting institutions are similar to the student populations at baccalaureate-degree granting institutions in terms of prior knowledge and learning in math and statistics making these two classifications indistinguishable from one another in terms of student performance on these skills.
An ANOVA followed by a Tukey multiple comparisons of means at 95% family-wise confidence level comparing the three different college levels (Associate’s, Baccalaureate/ Master’s and Doctoral) confirms that the mean differences of number of attempts needed to reach mastery are statistically significant (p < 0.001) among all three conditions. The confidence intervals for the differences are shown in Table 5.
There is also an instance of the same course from 2015 with 781 students. There are some differences between the course instances resulting in only 39 Good KCs for the 2015 data compared to 45 Good KCs for the 2014 data. The primary change between the 2014 and 2015 instance is that in the latter additional checkpoint (summative assessment) questions were added to allow for question pools and to address deficiencies in number of questions per skill. While the OLI model equally weights the formative and summative questions, the summative questions tend to be more difficult and carry higher importance in terms of a student’s grade. Using the same set of good KCs as in the analyses above (which includes 12 No learning and 4 Still high in the 2015 dataset) we get a mean of 4.9, standard deviation of 4.5 (N = 6212). This is 10% higher than the 2014 dataset, but may be explained by the inclusion of more difficult checkpoint questions. The 2015 set contains the same outliers as the 2014 set.
If we look only at the good KCs in the 2015 dataset, the number of good KCs drops to 39, (see Table 6). The mean is even higher at 6.2 with a standard deviation of 5.3 (N = 5553). In this dataset “pvalueinterp” and “hyptest-logic” did not even make it into the good KCs. Among the highest that did are at “probtools” as usual, but the three next ones are new: “apply_probability_rules_skill”, “estimater” and “onevstwosided”. However, all four are between 10.7 and 12.2.
Comparing the median number of questions per KC in the two statistics datasets (see Table 7) we can see that the median number of problems per KC increased from 5 to 8 across all 107 KCs from 2014 to 2015. For the Good KCs, the median number of problems increased from 5 to 9. The median for the Still high KCs remained relatively flat near 6 problems. The “No learning” median increased from 1 to 4.5, but was still half that for the median of the Good KCs indicating these KCs need additional questions.
Biology course
For the Biology course, see Table 8 for a summary, the mean was 3.1 with a standard deviation of 3.6 (N = 6211). There is an outlier named c33 which is a compound of the KCs: _u3_cell_function_explain_somatic_gametes_diff_skill,
_u3_chromosome_structure_describe_per_cell_cycle_skill and.
_u3_chromosomes_nbr_and_structure_per_type_skill. Joining KCs like this might be a good idea to reduce the number of necessary test opportunities, but in this particular case something might have gone wrong and a course designer should take a closer look at this KC. Removing that outlier results in a mean of 2.8 and a standard deviation of 3.1 (N = 5980).
In the Biology course, all students came from the same university, which rule out subdivisions. However, there are several knowledge models available that vary the number of estimated KCs and if we use Model1 with 50 good KCs, we get a mean of 2.9 and a standard deviation of 2.1. There are no outliers for Model1. As expected, the number of attempts needed per KC drops when the number of KCs increase. However, the total number of attempts to reach mastery increase from 6211 to 12,089, that is, in this case when the number of KCs increased by a factor 2 (from 25), so did the number of attempts necessary to reach mastery.
Engineering statics course
For the Engineering Statics course, see Table 9 for a summary, the mean was 5.3 with a standard deviation of 4.6 (N = 2152). There is an outlier with 14.4 attempts on average “couple_represents_net_zero_force”. Removing that outlier results in a mean of 4.6 with a standard deviation of 4.0 (N = 2014).
If we reduce the mastery limit to 10% in the Engineering Statics course, with the same outlier removed, the mean increases to 8.1 with a standard deviation of 5.0 (N = 948). Compared to the minimal differences in other courses, this course is deviating from the pattern. One explanation is that it is a more advanced course. In contrast to the other courses, it has recommended (not required) prerequisites which not all students may have fulfilled, resulting in more practice problems needed to reach mastery with the limit set to 10%.
Psychology course
Due to the size of the dataset, the Psychology course, see Table 10 for a summary, is divided in three different datasets with no overlap of students to make it possible for the server to compute the learning curves. We tried to use a supercomputer with 50GB of memory to be able to include the entire set, but to no avail. Due to random differences between students in these sets, the learning curves and classifications have minor differences between the sets. We used the KCs classified as Good in the largest of these three sets on the other two sets as well.
For the Psychology course the mean was 3.9 with a standard deviation of 3.9 (N = 32,355). There is an outlier “physical_psychological_changes_adulthood” at 16.9. Removing that outlier results in a mean of 3.7 with a standard deviation of 3.5 (N = 31,907).
For this course we also have access to results on the final exam. The Pearson’s product-moment correlation between the students’ number of attempts and the result of the final exam is shown in Table 11. All correlations are weak, but in the expected directions: the fewer attempts needed to master all skills (lower mean and median), the better result on the final exam. Also, the more KCs mastered, the better result on the final exam and the lower standard deviation, the better result. A scatterplot over attempts vs. final test score is illustrated in Fig. 2.
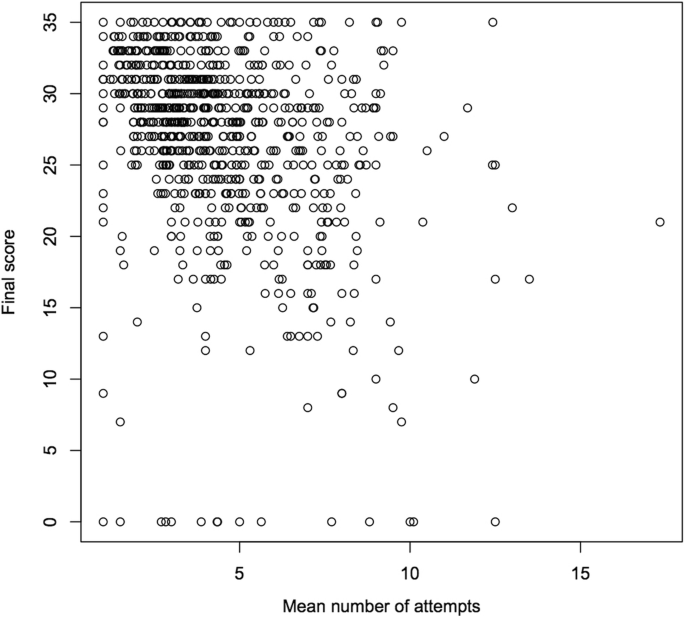
Scatterplot over the mean number of attempts and final test score
If we look only at the most difficult KCs (ten highest mean number of attempts) the correlation is somewhat stronger (mean − 0.36, median − 0.38) which is confirmed in the scatterplot in Fig. 3.

Scatterplot over the mean for the top ten KCs and final test score
All these students had finished the course in that sense they have a score on the final exam. If the KCs that require a high number of attempts had been unevenly distributed, for example most in the beginning, and low achieving (in terms of score on final exam) students stopped answering the online questions, that could explain the correlations above. However, as can be seen in Fig. 4, the distribution of high demanding and low demanding KCs is pretty even over the course.
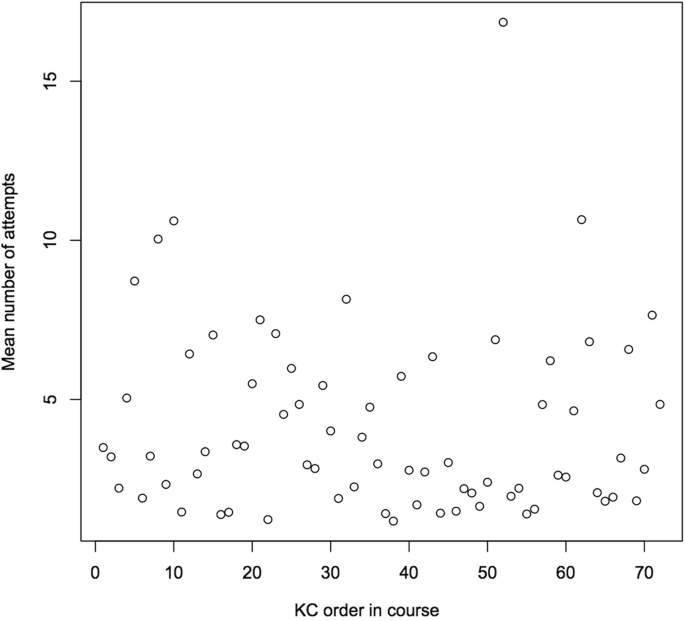
Distribution of mean number of attempts over the course
Discussion
We have performed a study of the number of opportunities necessary to reach mastery for four different college level courses. Although there are differences, these differences are small between KCs, student groups, and colleges. So, how many opportunities are enough to predict student mastery?
Ideally, an online course should never run out of questions for the learners as this would prevent some learners from mastering certain skills. However, speaking informally with students about this, there is an acceptance for new systems to not be perfect in this sense as long as this only occur occasionally. This acceptance is vital, because creating validated questions is time consuming, we estimate this to on average, one hour per problem (Piasentin, 2010), and this should be multiplied with the number of KCs for a course, making every extra question resource demanding. Once the course is up and running, troublesome KCs can be identified and extra questions for these can be added, but for new courses a rule of thumb could be helpful to get the course good enough without draining resources.
From Table 12 which summarize our findings we can see that the mean number of attempts to reach mastery is somewhere between 3 and 6 (with two exceptions discussed below), with a standard deviation between 3 and 5. These histograms generally follow a lognormal distribution in that the data skews towards very large positive values (Damodaran, n.d.). However, since the mean and standard deviation of the sample are available we can estimate μ* (log mean) and σ* (log standard deviation) of the lognormal distribution. For the mean, μ* equals x-bar / √ω and σ* equals exp.(√(log(ω)) where ω equals 1 + (s / x-bar)2 (Limpert et al., 2001). The log mean plus two standard deviation covers 98% of the students’ needs for opportunities. In the end, it is up to the course designers to decide what the coverage should be and how much resources can be used for questions, but as a rule of thumb: around seven questions. This can be compared to the median eight questions available per KC across all 107 KCs in the 2015 Statistics course and a median of nine questions per KC for those classified as “Good.” In contrast, some of the problematic KCs showed fewer opportunities such as the 7 out of 107 KCs that were classified as “Still high” (median 6 opportunities per KC) and four others as “Too little data” (median 4.5 opportunities per KC).
Where we have identified outliers we have removed them. The reason is that identifying outliers in this manner is a way of identifying parts of a course that need an overhaul. We do not believe that it is optimal for the learners to normally reach mastery in 4–5 attempts and suddenly need 15, and these are the averages, for some learners these numbers are much higher.
Despite all the manipulations with different students, courses, number of KCs and mastery thresholds, the mean values in number of attempts to reach mastery varied very little except in one course, the Engineering Statics course. While the effects of the mean for the statistics course increased less than an attempt when the level of mastery was halved from 20% to 10%, on the Engineering Statics course the mean almost doubled. We can therefore not state that the number of attempts is independent of the mastery threshold for an advanced course that has recommended prerequisites.
As expected, the number of attempts needed drops when the number of KCs increase. In this case when the number of KCs increased by a factor of two, so did the number of attempts necessary to reach mastery. More KCs means more questions for students to answer, but the questions are “easier” for students to master because the concept being covered in each question is smaller in scope. If we strive for efficiency in our courses, we should therefore also strive for a balance between the number of KCs and number of questions we pose. Fewer KCs results in more questions necessary on the same (aggregated) skill, while more KCs lead to more questions in total. As we could see in this example, too few KCs may also lead to too complex questions causing outliers among the questions.
In the Psychology course we were able to compare the number of attempts needed to achieve mastery with the results on a written final exam. The statistical analyses point in the same direction: the number of attempts is indicative of the students’ learning state (as measured by the exam).
A limitation of this study is the somewhat arbitrary threshold for mastery. As the true learning state of a student is not possible to determine we are confined to indirect methods such as asking questions.
Could this be generalized to other courses? Possibly, as the span of courses in this study cover four different subjects with rather small differences, with the one exception mentioned above. However, out of necessity all courses in this study are OLI courses, and the lack of differences might be an effect of the methods to create and implement OLI courses.
Could this be generalized to other students? All students in this study are adults so the validity of this study for K-12 education is limited. However, the differences between the different students groups we could extract (two vs four year colleges; Associate’s, Baccalaureate, Master’s and Doctoral colleges) are small. It would not be surprising if a study on high school students would show similar results. However, such studies must be done on courses intended for that age group, which the present OLI courses are not, but we are investigating other possibilities to reach down in age.
Conclusions
The number of opportunities necessary to reach mastery on OLI courses differs very little between the four different courses examined and also between different types of college students. For other researchers and teachers who are developing online courses we would recommend offering at least seven opportunities to test each skill, more if the course is advanced and the prior knowledge among the students may be uneven. An upper limit is a matter of resources, but these are better spent on identifying high demanding skills to either add more opportunities there, or to understand why those specific skills are so much more difficult to master and perhaps improve the instructions.
We have observed a natural linear relation between the number of KCs and number of attempts necessary to reach mastery in total. However, this is only based on a single course and more studies are needed to validate this.
The algorithms for classifying learning curves could be refined to detect outliers among the KCs. We believe KCs with a high number of opportunities needed to master them should be further investigated to understand why those particular skills are so difficult to master. It might be something wrong with the instruction. Even if there is nothing wrong, those skills have the largest potential of improvement in our goal to make learning as efficient as possible.
Abbreviations
- AFM:
-
Additive Factor Models
- ANOVA:
-
ANalysis Of VARiance
- BKT:
-
Bayesian Knowledge Tracing
- CMU:
-
Carnegie Mellon University
- DKT:
-
Deep Knowledge Tracing
- KC:
-
Knowledge Component
- KT:
-
Knowledge Tracing
- OLI:
-
Open Learning Initiative
- PFA:
-
Performance Factors Analysis
- SD:
-
Standard Deviation
References
J.R. Anderson, F.G. Conrad, A.T. Corbett, Skill acquisition and the LISP tutor. Cogn. Sci. 13(4), 467–505 (1989)
J.R. Anderson, J.M. Fincham, S. Douglass, Practice and retention: A unifying analysis. J. Exp. Psychol. Learn. Mem. Cogn. 25, 1120–1136 (1999)
R.S.J. Baker, in Advances in intelligent tutoring systems. Mining data for student models (Springer, 2010), pp. 323–337
O. Bälter, E. Enström, B. Klingenberg, The effect of short formative diagnostic web quizzes with minimal feedback. Comput. Educ. 60(1), 234–242 (2013)
Bier, N., Lip, S., Strader, R., Thille, C., & Zimmaro, D. (2014). An Approach to Knowledge Component / Skill Modeling in Online Courses. Open Learning, (April), 1–14
B.S. Bloom, Learning for mastery. Instruction and curriculum. Regional education Laboratory for the Carolinas and Virginia, topical papers and reprints, number 1. Evaluation Comment 1(2), n2 (1968)
S. Boulehouache, R. Maamri, Z. Sahnoun, A component-based knowledge domain model for adaptive human learning systems. Int J Knowledge Learning 10(4), 336–363 (2015)
Brownlee, J. (2013). A tour of machine learning algorithms. Retrieved September 7, 2018, from http://machinelearningmastery.com/a-tour-of-machine-learning-algorithms/
Cen, H., Koedinger, K. R., & Junker, B. (2007). Is over practice necessary? Improving learning efficiency with the cognitive tutor through educational data mining. Proceedings of the 13th International Conference on Artificial Intelligence in Education AIED 2007, 158, 511–518. Retrieved from http://citeseerx.ist.psu.edu/viewdoc/download?doi=10.1.1.142.7340&rep=rep1&type=pdf
K.S. Chen, L.R. Squire, Strength and duration of word-completion priming as a function of word repetition and spacing. Bull. Psychon. Soc. 28(2), 97–100 (1990)
M. Chi, K.R. Koedinger, G.J. Gordon, P. Jordon, K. VanLahn, in Proceedings of the 4th International Conference on Educational Data Mining, ed. by M. Pechenizkiy, T. Calders, C. Conati, S. Ventura, C. Romero, J. Stampe. Instructional factors analysis: A cognitive model for multiple instructional interventions (2011), pp. 61–70
Carnegie classification of institutions of higher education (2005). Retrieved September 7, 2018 from http://carnegieclassifications.iu.edu/definitions.php
A.T. Corbett, J.R. Anderson, Knowledge tracing: Modeling the acquisition of procedural knowledge. User Model. User-Adap. Inter. 4(4), 253–278 (1994)
Damodaran, A. (n.d.). Statistical distributions. Retrieved September 7, 2018, from http://people.stern.nyu.edu/adamodar/New_Home_Page/StatFile/statdistns.htm
M.C.W. English, T.a.W. Visser, Exploring the repetition paradox: The effects of learning context and massed repetition on memory. Psychon. Bull. Rev. 21(4), 1026–1032 (2013) https://doi.org/10.3758/s13423-013-0566-1
M. Galloway, J. Conner, D. Pope, Nonacademic effects of homework in privileged, high-performing high schools. J. Exp. Educ. 81(4), 490–510 (2013) https://doi.org/10.1080/00220973.2012.745469
Koedinger, K. R., Baker, R. Sj., Cunningham, K., Skogsholm, A., Leber, B., & Stamper, J. (2010). A data repository for the EDM community: The PSLC DataShop. Handbook of Educational Data Mining, 43
Koedinger, K. R., & Mathan, S. (2004). Distinguishing qualitatively different kinds of learning using log files and learning curves. In ITS 2004 Log Analysis Workshop (pp. 39–46)
S.V. Kolekar, R.M. Pai, M.M.M. Pai, Clustering learner profiles based on usage data in adaptive e-learning. Int J Knowledge Learning 11(1), 24–41 (2016)
Korossy, K. (1999). Modeling Knowledge as Competence and Performance. Knowledge Spaces: Theories, Empirical Research, and Applications, 103–132
B.A. Kuhl, M.C. Anderson, More is not always better: Paradoxical effects of repetition on semantic accessibility. Psychon. Bull. Rev. 18(5), 964 (2011)
Lee, J. I., & Brunskill, E. (2012). The Impact on Individualizing Student Models on Necessary Practice Opportunities. International Educational Data Mining Society
E. Limpert, W.A. Stahel, M. Abbt, Log-normal distributions across the sciences: Keys and clues on the charms of statistics, and how mechanical models resembling gambling machines offer a link to a handy way to characterize log-normal distributions, which can provide deeper insight into va. BioScience 51(5), 341–352 (2001)
M. Lovett, O. Meyer, C. Thille, The open learning initiative: Measuring the effectiveness of the OLI statistics course in accelerating student learning. J. Interact. Media Educ. 2008(1), 1–16 (2008) https://doi.org/http://doi.org/10.5334/2008-14
B. Marte, C.M. Steiner, J. Heller, D. Albert, Activity-and taxonomy-based knowledge representation framework. Int J Knowledge Learning 4(2–3), 189–202 (2008)
N. Matsuda, T. Furukawa, N. Bier, C. Faloutsos, in Proceedings of the 8th International Conference on Educational Data Mining. Machine beats experts: Automatic discovery of skill models for data-driven online course refinement (2015), pp. 101–108
G.A. Miller, in Linguistic Theory and Psychological Reality, ed. by M. Halle, J. Bresnan, G. A. Miller. Semantic relations among words (MIT Press, Cambridge, MA, 1978), pp. 60–117
D. Moseley, V. Baumfield, S. Higgins, M. Lin, J. Miller, D. Newton, et al., in ERIC. Thinking skill frameworks for Post-16 learners: An evaluation. A research report for the learning and skills research Centre (2004)
A. Newell, P.S. Rosenbloom, Mechanisms of skill acquisition and the law of practice. Cognitive Skills and Their Acquisition 1, 1–55 (1981)
V.O. Oladokun, A.T. Adebanjo, O.E. Charles-Owaba, Predicting students’ academic performance using artificial neural network: A case study of an engineering course. The Pacific Journal of Science and Technology 9(1), 72–79 (2008)
Z.A. Pardos, S.M. Gowda, R.S. Baker, N.T. Heffernan, The sum is greater than the parts: Ensembling models of student knowledge in educational software. ACM SIGKDD Explorations Newsletter 13(2), 37–44 (2012)
P.I. Pavlik, J.R. Anderson, Practice and forgetting effects on vocabulary memory: An activation-based model of the spacing effect. Cogn. Sci. 29(4), 559–586 (2005)
K.A. Piasentin, Exploring the optimal number of options in multiple-choice testing. Council on Licensure, Enforcement and Regulation (CLEAR) Exam Review 21(1), 18–22 (2010)
C. Piech, J. Bassen, J. Huang, S. Ganguli, M. Sahami, L.J. Guibas, J. Sohl-Dickstein, Deep knowledge tracing. Adv. Neural Inf. Proces. Syst., 505–513 (2015)
PSLC DataShop. (2015). Retrieved September 7, 2018, from https://pslcdatashop.web.cmu.edu/help?page=learningCurve#viewing
S. Reddy, I. Labutov, S. Banerjee, T. Joachims, in Proceedings of the 22Nd ACM SIGKDD International Conference on Knowledge Discovery and Data Mining (Pp. 1815–1824). Unbounded human learning: Optimal scheduling for spaced repetition (ACM, San Francisco, California, USA, 2016) https://doi.org/10.1145/2939672.2939850
L.C. Smith, Semantic satiation affects category membership decision time but not lexical priming. Mem. Cogn. 12(5), 483–488 (1984)
M.V. Yudelson, K.R. Koedinger, G.J. Gordon, in International Conference on Artificial Intelligence in Education. Individualized bayesian knowledge tracing models (Springer, 2013), pp. 171–180
I. Zukerman, D.W. Albrecht, Predictive statistical models for user modeling. User Model. User-Adap. Inter. 11(1–2), 5–18 (2001)
Acknowledgments
We are grateful for the assistance in accessing and interpreting data we received from Cindy Tipper, Senior Research Programmer, Human-Computer Interaction Institute at Carnegie Mellon University and Norman Bier, Director of the Open Learning Initiative (OLI) and Core Collaborations at Carnegie Mellon University.
Funding
This work was partly generously funded by KTH’s Resource Centre for Netbased education.
Availability of data and materials
We used the ‘CC-Statistics Spring 2014’, ‘ALMAP spring 2014’, ‘OLI Engineering Statics - Fall 2011 - CMU 148 students)’ and the ‘Psychology MOOC GT - Spring 2013 (100 students)’ datasets accessed via DataShop (Koedinger et al., 2010).
Author information
Authors and Affiliations
Contributions
OB proposed the study, did the majority of the data analysis, wrote most parts of the paper. DZ refined the study proposition, assisted with the interpretation of data, did parts of the data analysis, and wrote large parts of the paper. CT inspired and refined the study proposition and wrote parts of the paper and reviewed and refined the paper. All authors read and approved the final manuscript.
Corresponding author
Ethics declarations
Competing interests
The authors declare that they have no competing interests.
Publisher’s Note
Springer Nature remains neutral with regard to jurisdictional claims in published maps and institutional affiliations.
Rights and permissions
Open Access This article is distributed under the terms of the Creative Commons Attribution 4.0 International License (http://creativecommons.org/licenses/by/4.0/), which permits unrestricted use, distribution, and reproduction in any medium, provided you give appropriate credit to the original author(s) and the source, provide a link to the Creative Commons license, and indicate if changes were made.
About this article

Cite this article
Bälter, O., Zimmaro, D. & Thille, C. Estimating the minimum number of opportunities needed for all students to achieve predicted mastery. Smart Learn. Environ. 5, 15 (2018). https://doi.org/10.1186/s40561-018-0064-z
Received:
Accepted:
Published:
DOI: https://doi.org/10.1186/s40561-018-0064-z