- Research
- Open access
- Published:
Learning in smart environments: user-centered design and analytics of an adaptive learning system
Smart Learning Environments volume 5, Article number: 24 (2018)
Abstract
The complexity of today’s learning processes and practices entails various challenges. It is becoming much harder for teachers to observe, control, and adjust the learning process. Moreover, contemporary teaching is enhanced with different technologies and systems that not only support information-transfer, but also make this process more effective. In this paper we present the Programming Tutoring System (ProTuS), which provides smart and interactive content, personalization options, adaptive features, and learning analytics as a support for users engaged in learning complex cognitive skills. Our contribution in this paper is twofold, conceptual and empirical. The paper presents the interactive learning analytics component developed in ProTuS and the results from the empirical study. The study shows that students find adaptive learning systems to be useful in monitoring progress, promoting reflective practices, and receiving feedback to better understand their actions and learning strategies.
Introduction
There is a great potential for improving learning and teaching at universities around the world by utilizing different tools and methods that support personalized and adaptive learning. This implies that learning environments provide vast amounts of data about students, that can be analyzed and used to build learners’ profiles, personalize the learning experience, automate the assessment, and provide dynamic feedback on the learning progress. Furthermore, even if the analyses of the students’ interactions generate useful insights regarding the learning processes, the information needs to be properly interpreted and used as an input to introduce a well-scaffold activities (Rodríguez-Triana et al. 2015).
In order to enhance online and blended learning, the programming tutoring system (ProTuS) has been initially developed to provide various interactive courses in learning complex problem-solving skills (Ivanović et al. 2012). ProTuS is an adaptive and interactive learning platform that provides personalization and adaptation to support the learning process (Klašnja-Milićević et al. 2018). In other words, ProTuS covers a complex interplay of learning resources, tasks, instructions, social dynamics, and interactions, aimed at helping students learn a complex cognitive skill. Consequently, the aim of this study is to apply user-centered design approach to further develop ProTuS with additional components (e.g., interactive visualized learning analytics) that will support users to utilizing smart content (Brusilovsky et al. 2014).
Motivating students to take ownership of their learning, and supporting them to reflect upon it in order to make informed decisions, is an important driver in learning analytics (LA) research (Santos et al. 2012). Several educational platforms have already introduced LA components and data-driven learning activities in their systems, creating more adaptive and personalized learning experiences (Mangaroska and Giannakos 2018). What makes LA component in ProTuS unique is that it does not only provide visualizations of students’ activities, but also collects student feedback and adapt the learning context based on students’ preferences and needs. The LA component also collects information about learning outcomes, goals, and reports that students show particular interest in, and incorporate the data as an input for further personalization.
The LA component has been developed using design-based research methodology, which relies on rapid prototyping, deployment of artifacts, and observations in iterative cycles. The development contained several stages:
-
1
development of learning analytics component prototype;
-
2
integration of additional data sources from different applications;
-
3
evaluation and further development.
This paper reports: 1) the LA component development, 2) the feedback received from a focus group with teaching assistants and 3) the results of usability study with computer science freshmen.
The paper is organized as follows. The second section introduces the state-of-the-art overview, followed by the concept of learning in smart environments and the idea behind the implementation, presented in the following section. “The programming tutoring system - ProTuS” section presents the design and implementation of the learning analytics component in ProTuS. Details about the performed experiments and collected results are presented in “Method” and “Results” sections, respectively. The paper ends with the discussion section and the conclusion.
Related work
In an academic context, e-learning tools should not only provide the basic learning functionalities for which they have been designed (i.e., presentation of learning material, testing, etc.) but also additional features related with other academic goals, such as continuous assessment, tracking student progress, personalization, adaptation, etc. (Soler et al. 2010). Numerous methods and techniques have been proposed to increase the quality of teaching and to offer more engaging learning experiences to students. The most commonly used are: adaptation of the learning environment and teaching material, personalization, learning analytics, and open learning models.
Adaptive learning as a characteristic has the requirement to connect user activities and its visualizations to users’ learning goals. Creating this relation allows teachers and students to follow the learning curve and learning trajectories so that both sides could be able to reflect, make informed decisions, and scaffold interventions, (Santos et al. 2012).
Examples, experiences, challenges, and research reviews in the area of personalized learning are the subject to many contemporary researchers (O’Donnell et al. 2015; Santos et al. 2014). The idea behind personalized learning is to present each student with learning activities, specifically selected to accommodate diverse learning needs (O’Donnell et al. 2015). Different techniques, such as use of recommender systems or resource sequencing, have been implemented and evaluated to offer personalization and complement learner’s diversity (Klašnja-Milićević et al. 2009). In addition to automated personalization, the system should allow students different customization options, such as to define their own learning goals, choose the desired topics (domains), set the preferred time frame to accomplish these goals, and receive automatic guidelines presenting the most suitable and efficient path to reach those desired outcomes within the course. The main idea is to build specific context using user-centered analytics and create learning strategies that could guide students to accomplish their specified goals.
Learning analytics integrate the analysis of user interaction logs, learning resources, teaching goals, and the activities of students from different sources, in order to improve the creation of predictive models, recommendations, and reflections (Santos et al. 2012). Several examples of visualized LA (e.g. dashboards) exist, which visualize the different aspects of the learning process (Bodily et al. 2018). Examples include learners’ artifacts, time spent on tasks, social interaction, usage of resources, assignments and test results (Santos et al. 2012; Lin et al. 2016; Bull and Kay 2016; Charleer et al. 2016; Verbert et al. 2013). Experiences and guidelines for designing LA dashboards were discussed in Charleer et al. (2016). The authors suggested which data should be accessible to students (e.g., giving insight into the learning path to support reflection, peer comparison and self-regulated learning) and how to visualize it.
While in traditional personalized systems, learner models were hidden “under the hood” and used to personalize the learning process; open learner modeling introduced the ability to view and modify the state of students’ knowledge acquisition to support self-reflection, self-organized learning, and system transparency (Brusilovsky 2017). Opening the learner model generally involves more than simply showing the learner representations of their knowledge, as these representations are not usually designed for interpretation by humans, especially by those who are still learning a subject (Bull and Kay 2010; Kay 2000). The key challenge is in creating open learner model as an effective interface for presenting the students’ data and supporting interaction with it.
The goal of our research study is to fully implement the system that will take into account the personal traits of students to carry out a truly adaptive teaching and learning experiences. Moreover, the system will offer different visualization reports in order to support the concept of open learner model and in the same time offer teachers user-center analytics regarding learner’s activities and progress.
Motivation for the study
For e-learning environments, usability is a necessary condition for effective online learning. Therefore, ensuring usability and enhancement of user experience should be one of the main goals of e-learning application developers. In the same time, the diversity of learners, technological advancements, and radical changes in learning tasks present significant challenges and render the possibility of defining the context of use of e-learning applications (Zaharias and Poylymenakou 2009).
In order to anticipate the success and acceptance of educational system, usability and user experience study should investigate whether the system is pedagogically suitable, while in the same time attractive and engaging. According to research presented in Lin (2011), negative critical incidents and attitude are the main determinants of the users’ intention to continue using the system, irrespective of their level of e-learning experience. In general, the perceived user experience is described as the extent to which a person believes that e-learning can be a driving force towards achieving goals. Therefore, research is needed to identify and detect the problems, obstacles and breakdowns for the learner when interacting with a system (Triacca et al. 2004).
Several usability and user experience evaluation methodologies have been developed, that systematically combine usability inspection and user-testing (Zaharias and Poylymenakou 2009; Triacca et al. 2004; Ardito et al. 2004, 2006). Their common goal is to answer how usability and user experience influence the initial acceptance and subsequent continuous use of an e-learning system, and consequently, its overall success.
Learning in smart environments
The distributed and flexible nature of the learning process in blended and online learning environments, has created various new challenges for teachers, as it becomes much harder to observe, control, and adjust the learning experiences (Vozniuk et al. 2013). However, this does not imply that the control should be reinstated back to the teachers. It just conveys the idea that learning is distributed; thus contemporary learning systems should create engaging and efficient learning experiences to empower self-regulation and support learners towards autonomous learning (Hwang 2014).
Smart learning is a form of technology-enhanced learning that not only supports information-transfer and control of resource use, but also actively provides the necessary learning guidance, supportive tools, and help-seeking behavior at the right time and in the right form (Hwang 2014). The essence is in accommodating higher levels of personalization and customization features, gamification, collaboration, knowledge acquisition, and knowledge transfer that aligns in harmony with the complexity of distributed learning environments and stakeholder needs. Moreover, smart learning environments consider real-world contexts and situate the actors in real-world scenarios. Learning in smart environment is accomplished with utilization of the following elements (Fig. 1):
-
Adaptation of the learning process. Every interaction a user has with a learning system triggers an action (Burgos et al. 2007). Once the actions are triggered, the system tries to adapt and assign tasks to learners based on their progress, performance, and preferences utilizing a user model. The idea is to keep learners engaged in the learning tasks fitting their own parameters. Customization should be used as an addition to automatic adaptation, on behalf of the learners, satisfying their preferences and goals.
Fig. 1 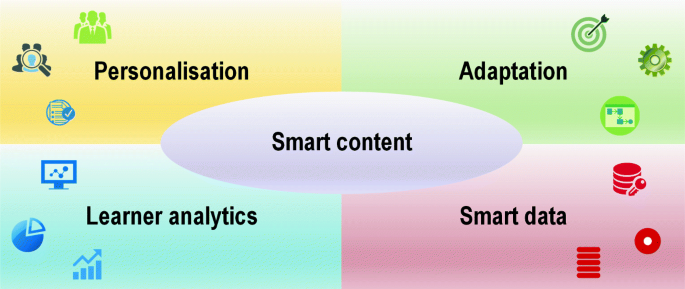
Learning in smart environment
-
Personalization. Learning environments should embrace personalization of the learning process according to the main characteristics of their learners (Kurilovas et al. 2014). In contrary to conventional learning environments which tend to treat learners as a homogeneous entity, personalized learning accepts learners as a heterogeneous mix of individuals (Klašnja-Milićević et al. 2018). Learners’ needs and characteristics (i.e. prior knowledge, intellectual level, learning habits) are important elements for personalization. On the other hand, customization is done on behalf of the learners (if not with their direct input, at least with their approval) to implement more significant learner-centered approach. Thus, competencies that learning system builds should be defined not only by the teacher and the content creators, but by the students as well.
Consequently, for personalization and customization purposes, individualized data can be collected threefold: (1) by conducting initial survey investigating students’ expectations and ambitions; (2) by offering customization settings where students could set up their own goals and the desired time-frame; (3) tracking the activities of learners and extracting meaningful information about students’ choices and their navigational patterns (Klašnja-Milićević et al. 2017).
-
Learning analytics. Learning analytics tracks students’ activities and progress over time, and through data visualization, feeds the results back to the students (Mangaroska and Giannakos 2018). Such feedback, if interpreted correctly, could empower students and teachers to make well-informed and data-driven decisions. Moreover, if the visualizations are based on analytics coming from various distributed learning environments, those visualizations would have higher accuracy and authenticity (Trætteberg et al. 2016). Thus, despite the technological challenges, learning analytics should consider the whole volume of learner-computer interaction, and not be restricted to learners’ interactions with a subset of the system.
Research on learning analytics dashboards (Santos et al. 2012; Verbert et al. 2013, 2014) has identified several crucial elements for developing an efficient dashboards:
-
data awareness;
-
visualizations of activity data;
-
self-reflection on activities;
-
sensemaking;
-
comparison with other learners;
-
goal-oriented visualizations;
-
open-learner model;
-
impact and behavior change.
-
-
Smart knowledge management. E-learning environments need to store and retrieve knowledge that is indispensable and used in decision making and problem solving (Liebowitz and Frank 2016). E-learning creates a growing repository of knowledge that, through tailored knowledge management processes, can personalize the learning experience. Different methods and techniques could be applied for collecting and analyzing multifaceted and semantically rich information concerning individual learning experiences (e.g., big data analytics, educational data mining, semantic web, knowledge maps, etc.) (Tikhomirov et al. 2015).

Supporting these elements in smart learning environments, could provide opportunities for learners to efficiently acquire various professional skills and competences, and reach autonomy in their learning (Nunan 1996). In a similar manner, such approach could provide teachers with a tool to track, analyze, and improve the existing teaching practices. On the other hand, the approach should not put complete control of the learning process in the hands of the teacher, and with carefully planned customization options, students should be able to alter the flow of their activities and adapt it to their goals and expectations.
The programming tutoring system - ProTuS
ProTuS is a tutoring system designed to provide learners with personalized courses from various domains (Ivanović et al. 2012). It is an interactive system that allows learners to use teaching material prepared for different courses and test their acquired knowledge (Fig. 2) (Klašnja-Milićević et al. 2018).

User interface of ProTuS
ProTuS offers the following advanced features:
-
1
Interactive visualizations of learners’ activities based on aggregation of heterogeneous data sources:
-
(a)
logs of user’s interactions in ProTuS (e.g., tests, communications, visited content and resources, etc.);
-
(b)
grades from assignments and lab activities;
-
(c)
logs and grades from third-party systems, such as Blackboard, MasteryGrids (Brusilovsky 2017) and Kahoot.
-
(a)
-
2
Personalization options implemented in ProTuS (e.g., tag-based recommendations, resource sequencing). ProTuS generates recommendations of learning resources for every student, and adapts the content to a particular learner (Klašnja-Milićević et al. 2018). Users have the chance to select or deselect the type of personalization that will maximize their learning curve.
-
3
Customization options. Currently, ProTuS allows learners to customize the appearance of the user interface (by displaying or hiding some of the internal frames) and to turn off/on recommendations. In future, learners should be able to set up their goals and the desired time-frame. Based on these inputs, the system will generate a proposed learning strategy that will most efficiently fulfill users predefined goals.
The learning content of a single course in ProTuS is divided into topics (lessons). Each topic contains several resources (presented in different tabs): Introduction, Basic info, Theory, Explanation, Examples, Syntax rules, and Activity (Fig. 3). For every topic an unlimited number of resources and tests can be attached. Resources that present explanations and syntax rules have two forms of presentation: verbal (textual) and visual (graphics or videos). Students can choose the presentation method based on their preferences.

The learning content in ProTuS
ProTuS provides the functionality of an adaptive learning environment that helps students to navigate through learning resources, track their actions, undertake automatic assessments (Fig. 4) and receive visualized reports on their progress. On the other hand, the system updates the learner model (with specific learners’ knowledge of course topics) accordingly. Moreover, the learner model in ProTuS is gradually build, by recording all learner’s activities, such as, tracking their individual choices and navigational patterns, monitoring their submissions, and recording the results from the JUnit tests. In fact, the system tracks all changes in students’ performance and knowledge level. Consequently, the data is then used for making further recommendations of learning material and activities to a specific learner.

Testing in ProTuS
Besides the study presented in this paper, the ultimate goal of our research is creation of foundation (i.e., smart and interactive content, support, dynamic and real-time feedback, personalization and adaptation features) for smart learning in ProTuS (Fig. 5). The current version of the system implements only two personalization methods: 1) different presentation techniques, and 2) recommendation of learning content based on Elo-rating algorithm (Elo 1978). This algorithm was originally developed for rating chess players, and it has recently been adapted and used in educational setting (Pelánek 2016; Antal 2013). Moreover, learners in ProTuS can customize the appearance of the system by turning on or off various personalization methods. In future, the authors plan implementation of a resource sequencing personalization method.

Smart learning in ProTuS
Regarding support of comprehensive customization in the learning environment, additional features in the settings panel are planned to be implemented. In the current version, the students can only turn automatic recommendations on or off. The future updates of the system will offer the choice of preferred topics, whether they want to increase theoretical or practical skills, pace of the instructions (i.e., time to conclude a topic), and choice of learning strategy (e.g., step-by-step guidance, learning through examples, video instructions, active learning, visual presentations, level of interaction). The system will use the chosen preferences to apply appropriate personalization method and adapt the appearance of the system and the content of the learning material.
During the first stage of the LA component development, open learner model and basic visualizations have been implemented. The component offers reports about the learners’ activities within ProTuS and visualized comparison of individual progress with the progress of other learners. Evaluation of the concept of smart learning and the LA component of ProTuS is presented in the “Method”, “Results” and “Discussion” sections.
Analytics component
ProTuS gradually builds learner profiles by monitoring and recording every interaction, navigation, test, or decision of the learner. Learner analytics component use various charts to describe individual and group test results, session time-frames, type of interactions and their duration, success rate for assignments, etc. Students can compare grades, activities, and trajectories of other students who are enrolled in the same course. The goal of the system is to enable students to take ownership of their own learning, reflect on their activities, and compare their results with other peers taking the same course.
To further support the concepts of open learner model, several visualization reports are already offered or planned for the future development (Fig. 6). These reports will in the future include: assignment and project results, overall grading, personal and group activities, fulfillment of learning objectives, etc.

Visualization in ProTuS
Method
Objectives
The research reported in this paper focuses on evaluation of the LA component as a first step towards more comprehensive implementation of smart learning in ProTuS. The authors would like to improve the analytics component by making it more interactive and appealing for use by students to follow their progress. Aligning learning analytics with learning design in order to create more meaningful tools, methods, and representations of data for teachers and learners is a promising step in creating improved user-centered learning experiences (Mangaroska and Giannakos 2017). Thus, the idea behind the development of ProTuS analytics component also includes the guidance of students as active agents in their learning process, with respect to their meta-cognitive abilities, as a support in becoming better learners. However, what is of particular importance and a subject for further investigation, are the learning strategies that are adopted by individual learners (Gašević et al. 2015). Tracking the activities of learners, could give valuable insights into how students learn with adaptive learning systems to promote understanding and build knowledge (Mangaroska and Giannakos 2018), as this data could increase the quality of the learning analytics component and the adaptive features of the system. Moreover, in order to examine the usability of learning analytics component of ProTuS, this study addresses the following research questions:
-
What are the practical applications for students to use adaptive learning system?
-
What is the level of satisfaction when interacting with ProTuS?
The following section presents the experimental setup to address the proposed research questions.
Procedure
The first step in this study includes data collection with the teaching assistants (TAs) that are assigned to the course Web technologies at ANONYMOUS University. Teaching assistants are one of the stakeholders that will utilize ProTuS to follow students’ learning trajectories and call for interventions if they perceive a particular student fails to keep up with the expected progress. Subsequently, a focus group was organized with the TAs to collect exemplary practices that they have accumulated over the last few years, working with students in the particular course.
After the focus group with the TAs, the second step was carried out during the Web Technologies class, where students were asked to interact with ProTuS and take the assigned tests. After finishing with the tests, the students were asked to fill in a usability questionnaire. Next, using affinity diagram technique (Beyer and Holtzblatt 1997) and usability survey, the authors aim to transform the gathered practical applications into design considerations for further development of visualizations based on user-centered analytics. Thus, the focus on user-centered participatory design is highly relevant for developing these visualizations that require a significant degree of user interaction (Cocea and Magoulas 2015).
Finally, the data gathered from the focus group and the usability survey will be systematized and used to develop new learning scenarios (Nardi 1992) and recommendations for new visualizations based on user-centered analytics. Figure 7 shows the research process that has been applied for this study.

Phases of design research
Participants
Ten teaching assistants (TAs) from the Web Technology course participated in the focus group and later filled in a usability questionnaire. The TAs have few years of experience in working with students, grading assignments, and following students’ project work in different programming and software engineering courses. On the other hand, the participants that tested ProTuS and later also filled in a usability questionnaire, were students enrolled at ANONIMOUS University, in the fall semester in the Web Technologies course. A total of 66 first year bachelor students participated in testing ProTuS, and 55 students filled in the usability questionnaire.
Data collection: study set-up
Ten teaching assistants spend more than an hour brainstorming and discussing the practical applications for students utilizing an adaptive learning system to monitor and evaluate their progress. The facilitators of the focus group practiced a deductive approach based on already formulated and theoretically driven key categories to lay TAs’ perspective on usage and challenges with adaptive learning systems. The brainstorming session was divided into two parts, before and after the use of ProTuS. The focus group started with brief introduction in adaptive learning systems and ProTuS so that the participants have a better understanding of the topic and the e-learning system. Thus, the facilitators asked the teaching assistants to discuss the following challenges:
-
What affordances are important for adaptive learning systems?
-
What type of content is appropriate for learning using adaptive learning system?
-
What assessment functionalities can be integrated in adaptive learning system?
This was done to avoid bias among the TAs that could have come from using a specific adaptive system (e.g., ProTuS), as well as to allow creativity flow. The second part of the focus group session focused on the following challenges after the TAs had the chance to spend some time interacting with ProTuS:
-
What type of visualizations can help you to reinforce awareness and reflection about your progress during the learning process?
-
What outcomes you expect from utilizing an adaptive learning system?
-
What kind of learning analytics can support you as a learner in the learning process?
Data collected from this session was used to create design considerations and to identify potential usability issues from the interaction with ProTuS. The focus group resulted in a collection of 53 practical applications that will be considered when re-designing and developing the analytics component of ProTuS.
The second part of the study included the introduction of ProTuS to the students during a regular classroom hours. Students were given instructions how to sign up in ProTuS and take a test that covered the content from the first five lectures. The students had five minutes to freely interact with ProTuS and get familiar with the system. Next, the students were instructed how to start the tests. The test lasted for 15 min and contained 40 multiple questions. The last five minutes, students had the chance to interact with the current visualizations the system offered. Finally, the students were asked to fill in a usability questionnaire (Brooke and et al. 1996) about their experience with the system, their reflections, and their subjective preferences. The study finished with two open-ended questions, asking students what kind of visualizations and analytics they find useful to have and use in order to follow their own progress and make decisions based upon it.
Data analysis: affinity diagram technique within focus group
When developing an adaptive learning system, it is important to distinguish between personalization (i.e., the purpose) and adaptation (i.e., the methods used to achieve the purpose) (Cocea and Magoulas 2015). Thus, this was the main idea employed during the data analysis. An affinity diagram technique (Beyer and Holtzblatt 1997) was applied to systematize and group the practical applications and challenges gathered from the focus group brainstorming session. The main steps of this technique are: (1) record all ideas on notes, (2) look for ideas that seem to be related, and (3) sort notes into groups. This is an inductive approach, by which the group builds common themes out of the individual ideas. However, for this study, the TAs were guided with six questions they had in front of them as the authors wanted to canalize their creativity within specific parts of the adaptive learning systems. Thus, a deductive approach was used based on already formulated and theoretically driven key categories. The participants were asked to review and position the ideas within the following categories: affordances, content, assessment functionalities, visualizations, outcomes and analytics. Next, notes were reviewed and grouped together conveying a particular group of ideas.
Since the authors considered affinity diagram as a starting point for constructing design features, next they decided to match the generated ideas (i.e., practical applications) with the best practices for designing adaptive learning systems.
Data analysis: usability study with ProTuS
Designing an adaptive learning system from usability perspective is a great challenge due to the complexity of the learning process and the need to meet diverse learners and various learning strategies (Nielsen 1994). Moreover, past studies (Alshammari et al. 2015; Zaharias and Poylymenakou 2009) show that usability is not considered during the design process nor even after it. Thus, if we do not know how easy and pleasant is our system to use, why would we expect users to use it? Consequently, this paper aims to understand and evaluate the usability of ProTuS. The usability study has been done using a System Usability Scale (SUS) questionnaire (Brooke and et al. 1996) with the TAs and the students after they interacted with the system. The authors decided to use SUS questionnaire due to two reasons: one, it can be used on small sample and still provide a reliable results; two, it is valid and proven instrument that can effectively distinct between usable and non-usable systems (Brooke and et al. 1996).
It is worth mentioning that usability and user experience are related, but not similar concepts: usability studies user’s ability to use an object to successfully accomplish a task, whereas user experience explores user’s interaction and their expectations, feelings, and aspirations as a result of the interaction with the object (Albert and Tullis 2013). Having in mind the difference between usability and user experience, the first part of the study i.e., the focus group session, was designed to examine the user experience, and the second part of the study was strictly focused on usability.
Results
Results from the affinity diagram
During the focus group session, TAs came up with 53 practical applications grouped into six categories. Using the affinity diagram technique, majority of the generated ideas (before using ProTuS) corresponded to three sub-categories: interface, gamification, and examination. The generated ideas after the use of ProTuS, corresponded to two sub-categories: settings and means. Table 1 shows the structure of the affinity diagram in terms of categories and sub-categories with examples of practical applications triggered from usage of an adaptive learning system. The three sub-categories are described below.
Interface
-
Description: Anticipated uses, learner’s needs, and application of the system and its components.
-
Example: Users like intuitive interfaces that would not require additional time to be allocated in order to learn how to use the system and its components. The content in the system should be interactive so that the users can feel engaged while using it.
Gamification
-
Description: Application of elements of game playing (e.g., badges/points scoring, competition with others) to maximize enjoyment and engagement based on learners’ interest, as a way to motivate users to continue learning.
-
Example: If interacting with the system can simulate playing a game, users will be more influenced and prone to using the system. Users would like to see gamified elements inside the system which will allow them to collaborate with other peers and create competitive environment where they can compere and measure achievements among individuals or among groups.
Examination
-
Description: Methods and materials to test current knowledge and automatically prepare scaffolds for students to improve their progress.
-
Example: The system should allow users to prepare for exams based on their progress so far. Users should be able to have an overview of their progress and learning path, and choose what gaps to cover or get system regulated interventions.
Table 2 shows the structure of the affinity diagram in terms of categories and sub-categories with examples of the best generated practices in using adaptive learning systems after the participants spent time working in ProTuS. The two sub-categories defined in the second part of the focus group session are described below.
Settings
-
Description: The preconditions and attitudes that help users to successfully interact with the system and its components.
-
Example: If users do not find the system useful by providing feedback on their learning curve and recommendations for improvement, they would not find it useful to use. In addition, one of their attitudes as a motivational factor towards using the system is getting better grade at the end of the course.
Means
-
Description: Methods and materials to prepare and motivate users for enhancing their willingness to interact with the system.
-
Example: System should provide tailored feedback and reports to users regarding the tasks they do, resources they use, scores they achieve, and help them to learn more effectively and efficiently.
Results from the usability study
The usability study has been conducted using a System Usability Scale (SUS) questionnaire and input from the TAs (i.e., the focus group) and students. The used questions, with their mean and standard deviation, for both the focus group and the students are presented in (Table 3). All questions are presented in a 5-point Likert Scale (from Strongly Disagree to Strongly Agree). ProTuS received the overall grade of 56.3 and 67.2 points from the focus group and the students, respectively. The low score received from the focus group was mainly a consequence of TAs responses on the questions 2–4 as they shared multiple complaints regarding the complexity of the user interface (Fig. 8). One month gap between the two usability studies gave us enough time to simplify the user interface, by moving multiple features of the system in the background (e.g., customization window, tagging interface dashboard, dashboard for changing presentation methods) or removing it completely (e.g., learning styles identification). As a result, in the second usability study a significant improvement was recorded from students’ perspective regarding the complexity of ProTuS.

Distribution of responses from the focus group
The overall score of 67.2 points received on the SUS questionnaire, indicates an acceptable usability of ProTuS. Students gave low scores for the first question, “I think that I would like to use this system frequently” (Fig. 9). However, we think this question might have biased answers as the activities within ProTuS are not defined as mandatory for the Web technologies course. On the other side, students find the system easy to use and consider that they do not need to have a technical person instructing them how to use the system. Two potential issues that might exist are regarding the integration of various functions in ProTuS and the existence of too much inconsistency in ProTuS, as majority students neither agreed nor disagreed. Therefore, the authors consider to explore further these potential usability issues while re-designing the analytics component.

Distribution of responses from the students
Looking at the two open-ended questions about visualizations and analytics, the participants shared some interesting points. First, when it comes to visualizations, students would like to see pie charts, not just bars of graphics. This shows that students understand the use of various graphics, since pie charts are usually used to compare parts of a whole, while bar graphs are used to easily track changes over time or between groups. In addition, they would like to be able to see visualizations pointing out what were their mistakes and how they can learn from it. Moreover, a very common answer was system’s ability to visualize their progress over time. Concerning the analytics, they would like the system to present aggregated analytics as an overview of their learning progress over time, the time they spend on tasks compared to how effective they performed those tasks, as well as the ability to compare results over time so that they can see the percentage of improvement at any point in time.
Discussion
ProTuS tries to establish the foundation towards the development of smart learning that provides students with personalized learning experiences, automated assessments, dynamic feedback, and interactive visualizations of the learning progress. The first stage in this process is the improvement and re-design of the analytics component. The idea behind the analytics component is to serve as an incentive to raise awareness among students and educators about smart learning by promoting the intention of learning ownership through self-reflection, sensemaking, and open learner model.
The first research question in this study aims to present an overview of the practical applications gathered from the users regarding adaptive learning systems. The focus group insights gathered from the teaching assistants focused on features that adaptive learning systems should have in order to be useful and usable. As many of the generated ideas by the teaching assistants are already implemented in the system (e.g., video material, communication options, portability, etc.), we considered this initial feedback very positive. Moreover, from the user experience perspective, they generated ideas that are not currently implemented in ProTuS, but are essential for building rich learner profiles, and smart learning content (Brusilovsky et al. 2014) as paths towards scaling up the usability of adaptive systems (Ardito et al. 2004).
One very important observation was regarding the information overload students currently have. Few students reported that having too many different data sources (e.g., eBook, lecture slides, the book for the course, ProTuS, the videos, etc.) create confusion what to choose as priority resource for learning. These findings support the idea behind the theory of distributed cognition (Hollan et al. 2000). Hence, this is one potential usability issue that need to be considered when integrating heterogeneous data across different learning platforms (Bakharia et al. 2016).
When it comes to user satisfaction, in general, we can say that students were satisfied with the learning experience offered by ProTuS. The score of 56.3 points on the SUS questionnaire by the TAs is a good example of the benefit of optimizing the usability of e-learning systems, because the later score of 67.2 points by the students, indicates that once the system usability was optimized, most of the users perceived the system as more usable. However, using only numerical averages is not the best strategy to uncover what works and what does not work in a system. This is supported with the wide spread of user reactions that suggest more work to uncover the reasons and motivations behind the individual responses. Thus, SUS questionnaire is only one way to measure usability of a system, leaving a lot of space for improvement and triangulation with other usability mechanisms (Brooke and et al. 1996). Since there is no single best measure of usability, the lack of data triangulation to obtain full understanding of the ProTuS system usability is one of the limitations of this study.
Consequently, the results and the feedback derived from the study indicate that students find adaptive learning systems to be useful in monitoring progress, promoting reflective practices, and receiving feedback based on analytics that support the understanding of their actions, resource use, and learning trajectories (Rienties and Toetenel 2016). Moreover, highly motivated and self-regulated learners are more likely to use e-learning systems (Zimmerman 1998). However, optimizing usability can be a significant factor to their satisfaction and motivation (Zaharias and Poylymenakou 2009). Furthermore, the concept of open-learner model offered students a highly appreciated and useful insight into their learning strategies. However, if we want adaptive systems to offer feedback with pedagogical components for guiding users to become better learners, the future learning analytics tools need to be developed considering theoretically established instructional strategies (Gašević et al. 2015).
The second aim of this paper was to set the foundation towards learning in smart environment. Knowing what users do when they need to solve a task (i.e., conceptual model), how they interact with the system (i.e., human-computer interaction), and in what situations they need guidance (i.e., learning scenarios), is what makes an adaptive system to be successful in knowledge, skills, and behavior modeling. Thus, the authors tried to identify the benefits that such environments could bring to the learning process and incorporate it in the design considerations. Results showed that after a slow start, the students became more engaged as the length of the user sessions increased over time. Table 2 shows that providing students with useful insight into their progress and learning curve, represents the first step towards implementation of smart learning. Moreover, if students achieve comprehensive understanding of their misconceptions and problems they account during learning, they can specify the desired learning goals and define the actions and areas they want to focus on. Such customization of the environment can lead to defining suitable and efficient learning strategies for the particular learner (Bakharia et al. 2016; Guerra et al. 2016). However, many of the findings summarized in Tables 1 and 2 show that the practical applications gathered from the users cluster around examination, implying that users’ focus is not learning as much as it is passing the assessments. This is also seen in the competitive framing of the gamification elements, as well as the reason behind the low score on the first question in the SUS questionnaire; the low probability that the students will use the system again. This insight goes back to the findings from the past research regarding personalization (O’Donnell et al. 2015; Santos et al. 2014; Kurilovas et al. 2014), customization (Klašnja-Milićević et al. 2017; Beyer and Holtzblatt 1997; Honey 2001), and autonomy (Weinstein 1987; Firat 2016).
As one can observe, creating and developing usable adaptive learning systems is a difficult and challenging task (Costabile et al. 2005). Therefore, having an adaptive system that is not used by students nor teachers hinders the vision of scaling up personalization and customization in e-learning. One of the questions that is currently looked over in the Technology-enhanced learning (TEL) community is whether adaptive systems should assist in humans’ decision making or make decisions on behalf of humans? Consequently, the authors leave the reader to think whether the results that were gathered from the focus group session and the usability questionnaire should be treated in terms of design considerations for adaptive systems that assist humans in decision making or as an input for developing future automated processes in adaptive systems (Zliobaite et al. 2012).
Design considerations
The data insights from this study are used to present possible design considerations for further development of ProTuS analytics component. The following design considerations focus on:
-
Interactivity in adaptive learning system could be achieved by designing competition module that allows students to compare their level of knowledge, skills, and results with their peers (Lavoué et al. 2018).
-
The quality of the learning resources and the learning design, play an important role in influencing students to learn and interact within e-learning systems (Rienties and Toetenel 2016).
-
Allowing students to set up their learning goals, their learning pace, and the time-frame could increase their awareness in taking ownership of the learning progress and the personalization options offered by the adaptive system (Piccoli et al. 2001).
-
Learning systems should support scaffolding and tailored assessment to address learner’s growth, diversity, and motivation (Mangaroska et al. 2018).
-
Adaptive systems should incorporate different learning strategies that will support learners to improve by modifying goals, actions, and learning trajectories (Waalkens et al. 2013).
Conclusions
To address several known obstacles in development of adaptive learning systems, this study focused on examining the usability of ProTuS, an adaptive and interactive learning platform and evaluation of the analytics component. The aim of the study was to transform the generated practical applications from the focus group into design considerations for further development of ProTuS interface and the analytics component. The study demonstrated that students find the learning environment in ProTuS attractive, and in the same time useful for reflecting on their progress. They were especially fond of the interactive visualizations that allow them to compare their results with the results of their peers. The SUS score of 67.2 presents the system as usable, underlining the necessity to further improve and scale the usability of ProTuS. Although visualized analytics increases the engagement of the students, a known design challenge arose from students’ feedback: how to design adaptive systems that would not add further complexity to the system by making the system more interactive? High levels of personalization and customization features in online learning environment can increase complexity of the systems, hence the implementation of this features need to be smooth and not visible to the users.
In future, the authors plan to further develop the learning analytics component of ProTuS and provide more interactive visualizations options of the data aggregated from additional sources (e.g., assignments and projects, course grading, and third-party software). In fact, the analytics component is a very important part of ProTuS as it should establish the foundation for development of learning in smart environments. Furthermore, the authors plan to investigate how complex analytics can provide benefits and valuable input for defining appropriate teaching strategies, and how this strategies can be implemented in online environments to support smart learning.
Abbreviations
- LA:
-
Learning analytics
- SUS:
-
System usability scale
- TA:
-
teaching assistant
- TEL:
-
Technology-enhanced learning
References
W. Albert, T. Tullis, Measuring the User Experience: Collecting, Analyzing, and Presenting Usability Metrics (Morgan Kaufmann, Burlington, Massachusetts, United States, 2013).
M. Alshammari, R. Anane, R. J. Hendley, in Human-Computer Interaction. Design and usability evaluation of adaptive e-learning systems based on learner knowledge and learning style (SpringerCham, 2015), pp. 584–591.
M. Antal, On the use of elo rating for adaptive assessment. Stud. Univ. Babes-Bolyai Inform.58(1), 29–41 (2013).
C. Ardito, M. F. Costabile, M. De Marsico, R. Lanzilotti, S. Levialdi, T. Roselli, V. Rossano, An approach to usability evaluation of e-learning applications. Univ. Access Inf. Soc.4(3), 270–283 (2006).
C. Ardito, M. De Marsico, R. Lanzilotti, S. Levialdi, T. Roselli, V. Rossano, M. Tersigni, in Proceedings of the Working Conference on Advanced Visual Interfaces. Usability of e-learning tools (ACMNew York, 2004), pp. 80–84.
A. Bakharia, L. Corrin, P. de Barba, G. Kennedy, D. Gašević, R. Mulder, D. Williams, S. Dawson, L. Lockyer, in Proceedings of the Sixth International Conference on Learning Analytics & Knowledge. A conceptual framework linking learning design with learning analytics (ACMNew York, 2016), pp. 329–338.
H. Beyer, K. Holtzblatt, Contextual Design: Defining Customer-centered Systems (Elsevier, Amsterdam, Netherlands, 1997).
R. Bodily, J. Kay, V. Aleven, I. Jivet, D. Davis, F. Xhakaj, K. Verbert, in Proceedings of the 8th International Conference on Learning Analytics and Knowledge. Open learner models and learning analytics dashboards: a systematic review (ACMNew York, 2018), pp. 41–50.
J. Brooke, et al., Sus-a quick and dirty usability scale. Usability Eval. Ind.189(194), 4–7 (1996).
P. Brusilovsky, in Proceedings of the 2017 ACM Workshop on Intelligent Interfaces for Ubiquitous and Smart Learning. Intelligent interfaces for open social student modeling (ACMNew York, 2017), pp. 1–1.
P. Brusilovsky, S. Edwards, A. Kumar, L. Malmi, L. Benotti, D. Buck, P. Ihantola, R. Prince, T. Sirkiä, S. Sosnovsky, et al., in Proceedings of the Working Group Reports of the 2014 on Innovation & Technology in Computer Science Education Conference. Increasing adoption of smart learning content for computer science education (ACMNew York, 2014), pp. 31–57.
S. Bull, J. Kay, in Advances in Intelligent Tutoring Systems. Open learner models (SpringerBerlin, 2010), pp. 301–322.
S. Bull, J. Kay, Smili: a framework for interfaces to learning data in open learner models, learning analytics and related fields. Int. J. Artif. Intell. Educ.26(1), 293–331 (2016).
D. Burgos, C. Tattersall, R. Koper, How to represent adaptation in e-learning with ims learning design. Interact. Learn. Environ.15(2), 161–170 (2007).
S. Charleer, J. Klerkx, E. Duval, T. De Laet, K. Verbert, in European Conference on Technology Enhanced Learning. Creating effective learning analytics dashboards: Lessons learnt (SpringerCham, 2016), pp. 42–56.
M. Cocea, G. D. Magoulas, Participatory learner modelling design: A methodology for iterative learner models development. Inf. Sci.321:, 48–70 (2015).
M. F. Costabile, M. De Marsico, R. Lanzilotti, V. L. Plantamura, T. Roselli, in Proceedings of the 38th Annual Hawaii International Conference on System Sciences(HICSS), vol. 01. On the usability evaluation of e-learning applications (IEEE, 2005), p. 6b. https://doi.org/10.1109/HICSS.2005.468.
A. E. Elo, The Rating of Chessplayers, Past and Present (Arco Pub., New York, 1978).
M. Firat, Measuring the e-learning autonomy of distance education students. Open Prax.8(3), 191–201 (2016).
D. Gašević, S. Dawson, G. Siemens, Let’s not forget: Learning analytics are about learning. TechTrends. 59(1), 64–71 (2015).
J. Guerra, R. Hosseini, S. Somyurek, P. Brusilovsky, in Proceedings of the 21st International Conference on Intelligent User Interfaces. An intelligent interface for learning content: Combining an open learner model and social comparison to support self-regulated learning and engagement (ACMNew York, 2016), pp. 152–163.
J. Hollan, E. Hutchins, D. Kirsh, Distributed cognition: toward a new foundation for human-computer interaction research. ACM Trans. Comput.-Hum. Interact. (TOCHI). 7(2), 174–196 (2000).
P. Honey, E-learning: a performance appraisal and some suggestions for improvement. Learn. Organ.8(5), 200–203 (2001).
G. -J. Hwang, Definition, framework and research issues of smart learning environments-a context-aware ubiquitous learning perspective. Smart Learn. Environ.1(1), 4 (2014).
M. Ivanović, D. Mitrović, Z. Budimac, B. Vesin, L. Jerinić, in International Conference on Web-Based Learning. Different roles of agents in personalized programming learning environment (SpringerBerlin, Heidelberg, 2012), pp. 161–170.
J. Kay, in International Conference on Intelligent Tutoring Systems. Stereotypes, student models and scrutability (SpringerBerlin, 2000), pp. 19–30.
A. Klašnja-Milićević, M. Ivanović, B. Vesin, Z. Budimac, Enhancing e-learning systems with personalized recommendation based on collaborative tagging techniques. Appl. Intell.48(6), 1519–1535 (2018).
A. Klašnja-Milićević, B. Vesin, M. Ivanović, Social tagging strategy for enhancing e-learning experience. Comput. Educ.118:, 166–181 (2018).
A. Klašnja-Milićević, B. Vesin, M. Ivanović, Z. Budimac, in Proceedings of The 4th International Conference on Information Technology ICIT, Jordan. Integration of recommendations into java tutoring system (Al-Zaytoonah UniversityAmman. Jordan, 2009).
A. Klašnja-Milićević, B. Vesin, M. Ivanović, Z. Budimac, L. C. Jain, in E-Learning Systems. Personalization and adaptation in e-learning systems (SpringerCham, 2017), pp. 21–25.
E. Kurilovas, S. Kubilinskiene, V. Dagiene, Web 3.0–based personalisation of learning objects in virtual learning environments. Comput. Hum. Behav.30:, 654–662 (2014).
É Lavoué, B. Monterrat, M. Desmarais, S. George, Adaptive gamification for learning environments. IEEE Trans. Learn. Technol. (2018).
J. Liebowitz, M. Frank, Knowledge Management and E-learning (CRC press, Boca Raton, Florida, 2016).
K. -M. Lin, e-learning continuance intention: Moderating effects of user e-learning experience. Comput. Educ.56(2), 515–526 (2011).
C. -H. Lin, S. -S. Hu, H. -Y. Lai, C. -F. Chiang, H. -C. Tseng, Y. -C. Cheng, in International Symposium on Emerging Technologies for Education. Visca: A dashboard system to visualize learning activities from e-learning platforms (SpringerLondon, 2016), pp. 422–427.
K. Mangaroska, M. Giannakos, in European Conference on Technology Enhanced Learning. Learning analytics for learning design: Towards evidence-driven decisions to enhance learning (SpringerCham, 2017), pp. 428–433.
K. Mangaroska, M. N. Giannakos, Learning analytics for learning design: A systematic literature review of analytics-driven design to enhance learning. IEEE Trans. Learn. Technol.11:, 1–19 (2018).
K. Mangaroska, R. Tahir, M. Lorås, A. Mavroudi, in 2018 IEEE 18th International Conference on Advanced Learning Technologies (ICALT). What do we know about learner assessment in technology-rich environments? A systematic review of systematic reviews (IEEEPiscataway, 2018), pp. 16–20.
B. A. Nardi, The use of scenarios in design. ACM SIGCHI Bull.24(4), 13–14 (1992).
J. Nielsen, Usability Engineering (Elsevier, Amsterdam, Netherlands, 1994).
D. Nunan, Towards autonomous learning: some theoretical, empirical and practical issues. Taking Control. Autonomy Lang. Learn.1326:, 13–26 (1996).
E. O’Donnell, S. Lawless, M. Sharp, V. Wade, A review of personalised e-learning: Towards supporting learner diversity. International Journal of Distance Education Technologies (IGI Global, Hershey, 2015).
R. Pelánek, Applications of the elo rating system in adaptive educational systems. Comput. Educ.98:, 169–179 (2016).
G. Piccoli, R. Ahmad, B. Ives, Web-based virtual learning environments: A research framework and a preliminary assessment of effectiveness in basic it skills training. MIS Q.25:, 401–426 (2001).
B. Rienties, L. Toetenel, The impact of learning design on student behaviour, satisfaction and performance: A cross-institutional comparison across 151 modules. Comput. Hum. Behav.60:, 333–341 (2016).
M. J. Rodríguez-Triana, A. Martínez-Monés, J. I. Asensio-Pérez, Y. Dimitriadis, Scripting and monitoring meet each other: Aligning learning analytics and learning design to support teachers in orchestrating cscl situations. Br. J. Educ. Technol.46(2), 330–343 (2015).
O. C. Santos, J. G. Boticario, D. Pérez-Marín, Extending web-based educational systems with personalised support through user centred designed recommendations along the e-learning life cycle. Sci. Comput. Program.88:, 92–109 (2014).
J. L. Santos, S. Govaerts, K. Verbert, E. Duval, in Proceedings of the 2nd International Conference on Learning Analytics and Knowledge. Goal-oriented visualizations of activity tracking: a case study with engineering students (ACMNew York, 2012), pp. 143–152.
J. Soler, I. Boada, F. Prados, J. Poch, R. Fabregat, in Education Engineering (EDUCON), 2010 IEEE. A web-based e-learning tool for uml class diagrams (IEEE, 2010), pp. 973–979.
V. Tikhomirov, N. Dneprovskaya, E. Yankovskaya, in Smart Education and Smart e-Learning. Three dimensions of smart education (SpringerBerlin, Heidelberg, 2015), pp. 47–56.
H. Trætteberg, A. Mavroudi, M. Giannakos, J. Krogstie, in European Conference on Technology Enhanced Learning. Adaptable learning and learning analytics: A case study in a programming course (SpringerCham, 2016), pp. 665–668.
L. Triacca, D. Bolchini, L. Botturi, A. Inversini, in EdMedia: World Conference on Educational Media and Technology. Mile: Systematic usability evaluation for e-learning web applications (Association for the Advancement of Computing in Education (AACE)Lugano, 2004), pp. 4398–4405.
K. Verbert, E. Duval, J. Klerkx, S. Govaerts, J. L. Santos, Learning analytics dashboard applications. Am. Behav. Sci.57(10), 1500–1509 (2013).
K. Verbert, S. Govaerts, E. Duval, J. L. Santos, F. Van Assche, G. Parra, J. Klerkx, Learning dashboards: an overview and future research opportunities. Pers. Ubiquit. Comput.18(6), 1499–1514 (2014).
A. Vozniuk, S. Govaerts, D. Gillet, in Advanced Learning Technologies (ICALT), 2013 IEEE 13th International Conference On. Towards portable learning analytics dashboards (IEEE, 2013), pp. 412–416.
M. Waalkens, V. Aleven, N. Taatgen, Does supporting multiple student strategies lead to greater learning and motivation? Investigating a source of complexity in the architecture of intelligent tutoring systems. Comput. Educ.60(1), 159–171 (2013).
C. E. Weinstein, Fostering learning autonomy through the use of learning strategies. J. Read.30(7), 590–595 (1987).
P. Zaharias, A. Poylymenakou, Developing a usability evaluation method for e-learning applications: Beyond functional usability. Intl. J. Hum.–Comput. Interact.25(1), 75–98 (2009).
B. J. Zimmerman, Academic studing and the development of personal skill: A self-regulatory perspective. Educ. Psychol.33(2-3), 73–86 (1998).
I. Zliobaite, A. Bifet, M. Gaber, B. Gabrys, J. Gama, L. Minku, K. Musial, Next challenges for adaptive learning systems. ACM SIGKDD Explor. Newsl.14(1), 48–55 (2012).
Availability of data and materials
The datasets used and/or analyzed during the current study are available from the corresponding author on reasonable request.
Author information
Authors and Affiliations
Contributions
BV wrote most of the paper and developed the framework towards learning in smart environments. KM conducted the experiment and wrote the methodology and results section. MG helped with the research design, valuable discussions, and editing the paper. All authors read and approved the final manuscript.
Corresponding author
Ethics declarations
Competing interests
The authors declare that they have no competing interests.
Publisher’s Note
Springer Nature remains neutral with regard to jurisdictional claims in published maps and institutional affiliations.
Rights and permissions
Open Access This article is distributed under the terms of the Creative Commons Attribution 4.0 International License (http://creativecommons.org/licenses/by/4.0/), which permits unrestricted use, distribution, and reproduction in any medium, provided you give appropriate credit to the original author(s) and the source, provide a link to the Creative Commons license, and indicate if changes were made.
About this article

Cite this article
Vesin, B., Mangaroska, K. & Giannakos, M. Learning in smart environments: user-centered design and analytics of an adaptive learning system. Smart Learn. Environ. 5, 24 (2018). https://doi.org/10.1186/s40561-018-0071-0
Received:
Accepted:
Published:
DOI: https://doi.org/10.1186/s40561-018-0071-0